Week 3
| Site: | Newgate University Minna - Elearning Platform |
| Course: | Data Management |
| Book: | Week 3 |
| Printed by: | Guest user |
| Date: | Sunday, 14 June 2026, 3:53 AM |
Description
Teaching and Learning Methods to be Employed
i. Illustrated lecture with step-by-step ER diagram construction
ii. Hands-on ER diagram drawing exercise (paper or draw.io)
iii. Case study: Modelling a Nigerian hospital information system
iv. Collection of Assignment 1
Learning Outcomes / Objectives
By the end of this week, students should be able to:
1. Explain the purpose of conceptual data modelling.
2. Define entities, attributes, and relationships in the ER model.
3. Classify attributes by type (simple, composite, multi-valued, derived).
4. Identify and specify cardinality ratios and participation constraints.
5. Draw a complete Entity-Relationship (ER) diagram for a given scenario.
3.1 Conceptual Data Modelling
Conceptual data modelling is the process of creating a high-level, abstract representation of the data requirements of an organisation, independent of any specific DBMS or physical implementation. The most widely used conceptual model is the Entity-Relationship (ER) model, introduced by Peter Chen in 1976.
The ER model allows database designers to communicate with non-technical stakeholders (managers, end users) using graphical diagrams that are easy to understand without database expertise.
Entities and Entity Sets
An ENTITY is a real-world object or concept that is distinguishable from other objects and about which data is to be stored.
EXAMPLES of entities in a Nigerian university database:
1. STUDENT (each registered student is a distinct entity)
2. COURSE (each taught course is an entity)
3. LECTURER (each academic staff member is an entity)
4. DEPARTMENT (each university department is an entity)
5. EXAMINATION (each examination sitting is an entity)
An ENTITY TYPE is the category/classification. An ENTITY SET is the collection of all entities of a particular type. In ER diagrams, entity types are represented as RECTANGLES.
|
Strong vs. Weak Entities: A STRONG entity has its own unique identifier (primary key). E.g., STUDENT identified by MatricNumber. A WEAK entity cannot be uniquely identified by its own attributes alone and depends on a strong entity. E.g., a DEPENDENT (spouse/child) of a STAFF member identified only by (StaffID + DependentName). Weak entities are drawn as DOUBLE RECTANGLES. |
3.2 Attributes
An ATTRIBUTE is a property or characteristic of an entity type. In ER diagrams, attributes are represented as OVALS connected to their entity type.
|
Attribute Type |
Definition and Example |
|
Simple (Atomic) |
Cannot be divided further. E.g., StudentID, DateOfBirth, GPA |
|
Composite |
Can be divided into smaller sub-parts. E.g., Address → (StreetNo, StreetName, LGA, State). E.g., FullName → (FirstName, MiddleName, LastName) |
|
Multi-valued |
Can have multiple values for one entity. E.g., a Lecturer may have multiple PhoneNumbers. Drawn as DOUBLE OVAL. |
|
Derived |
Value is computed from other attributes. E.g., Age derived from DateOfBirth; TotalCreditUnits derived from registered courses. Drawn as DASHED OVAL. |
|
Key Attribute |
Uniquely identifies each entity instance. E.g., MatricNumber for STUDENT. Underlined in ER diagram. |
|
Null Attribute |
May have no value for some instances. E.g., MiddleName may be absent for some students. |
3.3 Relationships and Cardinality Ratios
A RELATIONSHIP TYPE represents an association between two or more entity types. In ER diagrams, relationships are drawn as DIAMONDS connected to the participating entity types.
RELATIONSHIP EXAMPLES from Newgate University:
1. STUDENT ENROLS-IN COURSE
2. LECTURER TEACHES COURSE
3. STUDENT BELONGS-TO DEPARTMENT
4. STAFF HAS DEPENDENT
Cardinality Ratios
Cardinality describes the maximum number of times an entity instance in one entity type can be associated with instances of another entity type.
|
Cardinality |
Notation |
Nigerian Example |
|
One-to-One (1:1) |
1 — 1 |
One STAFF member has exactly one NIN (National Identity Number) |
|
One-to-Many (1:N) |
1 — N |
One DEPARTMENT has many STUDENTS; each STUDENT belongs to one DEPARTMENT |
|
Many-to-Many (M:N) |
M — N |
Many STUDENTS enrol in many COURSES; each COURSE has many STUDENTS |
3.4 Participation Constraints
Participation indicates whether all or only some entity instances participate in a relationship:
1. TOTAL PARTICIPATION (Mandatory) — Every instance of the entity type MUST participate in the relationship. Drawn as a DOUBLE LINE. E.g., every STUDENT must BELONG-TO a DEPARTMENT.
2. PARTIAL PARTICIPATION (Optional) — Some instances may not participate. Drawn as a SINGLE LINE. E.g., not every STAFF member has a DEPENDENT.
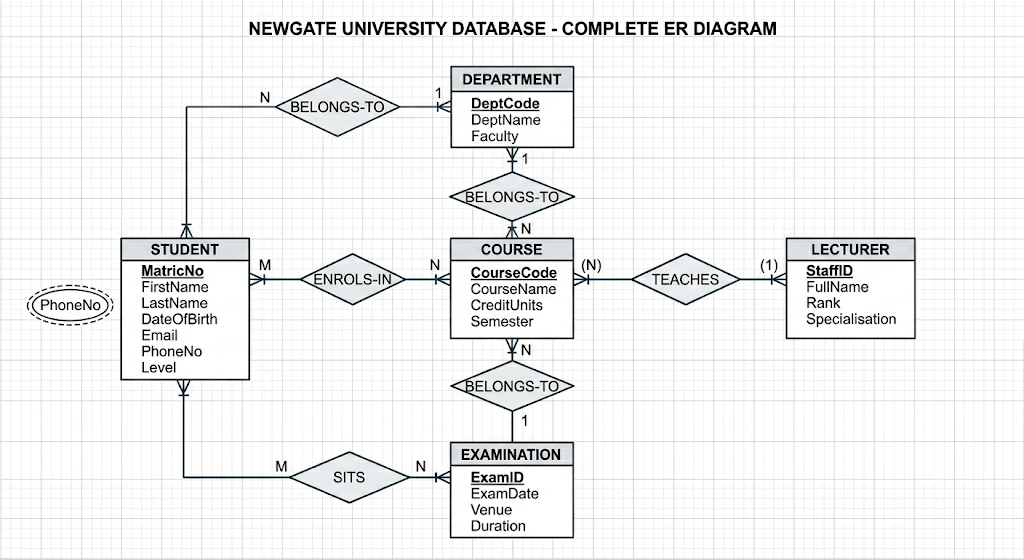
Complete ER Diagram Example: Newgate University Database
ENTITIES: STUDENT, COURSE, LECTURER, DEPARTMENT, EXAMINATION
STUDENT attributes: MatricNo (key), FirstName, LastName, DateOfBirth, Email, PhoneNo (multi-valued), Level
COURSE attributes: CourseCode (key), CourseName, CreditUnits, Semester
LECTURER attributes: StaffID (key), FullName, Rank, Specialisation
DEPARTMENT attributes: DeptCode (key), DeptName, Faculty
EXAMINATION attributes: ExamID (key), ExamDate, Venue, Duration
RELATIONSHIPS:
1. STUDENT ENROLS-IN COURSE [M:N, Total:Total] — Many students enrol in many courses
2. LECTURER TEACHES COURSE [1:N, Partial:Total] — One lecturer teaches many courses; each course is taught by one lecturer
3. STUDENT BELONGS-TO DEPARTMENT [N:1, Total:Partial] — Many students belong to one department
4. COURSE BELONGS-TO DEPARTMENT [N:1, Total:Partial] — Many courses belong to one department
5. STUDENT SITS EXAMINATION [M:N] — Students sit many examinations; each examination has many students
|
ER Diagram Notation Summary |
Symbol/Representation |
|
Entity Type (strong) |
Rectangle |
|
Entity Type (weak) |
Double Rectangle |
|
Attribute (simple) |
Oval |
|
Attribute (multi-valued) |
Double Oval |
|
Attribute (derived) |
Dashed Oval |
|
Key Attribute |
Underlined text in Oval |
|
Relationship |
Diamond |
|
Identifying Relationship (weak) |
Double Diamond |
|
Total Participation |
Double Line |
|
Partial Participation |
Single Line |
Reading List / References
Elmasri, R. & Navathe, S. B. (2016). Fundamentals of Database Systems, Chapter 3: ER Model. Pearson.
Connolly, T. & Begg, C. (2015). Database Systems, Chapter 12: ER Modelling. Pearson.
Chen, P. P. (1976). The Entity-Relationship Model: Toward a Unified View of Data. ACM Transactions on Database Systems, 1(1), 9-36.
Activities
|
Self-Assessment Quiz: 1. What is the difference between an entity and an entity type? 2. Name FOUR types of attributes and give an example of each from a STAFF entity. 3. What is a weak entity? Give a Nigerian example. 4. A department has many lecturers but each lecturer belongs to only one department. What is the cardinality of this relationship? |
|
ER Diagram Exercise: Draw a complete ER diagram for a HOSPITAL MANAGEMENT SYSTEM for a Nigerian Teaching Hospital. Include at minimum: PATIENT, DOCTOR, WARD, APPOINTMENT, PRESCRIPTION. For each entity, specify at least 4 attributes including the key attribute. Specify cardinality and participation for all relationships. You may use draw.io, Lucidchart, or pencil and paper. |